
People love infographics, right? Well… To be honest, I found myself enjoying infographics than just plain old regular text.
Information graphics or infographics, according to wikipedia, are graphic visual representations of information, data or knowledge intended to present complex information quickly and clearly.
This is actually the key: present complex information quickly and clearly. Who doesn’t love simple and easy to digest information? Right! Now you are in the same boat as me. We are all busy and like understanding difficult topics in a matter of minutes rather than hours.
As you might know there are many ways to increase your blog traffic. A few of the popular methods of generating targeted traffic to websites include things like getting involved in forums and focusing on social media. If you understand how Google works you can focus on Search Engine Optimization (SEO) for each of your posts. Alternatively you can just write great posts and articles every other day and follow it up with writing plenty of great guest posts for popular blogs within your niche (or even popular blogs in other niches)
One of my favorite ways to generate targeted traffic though is to create great looking infographics and then let other people promote them. Why? First. I’ve explained it at the beginning of this article; people love infographics. Second. Have a quick look at this screenshot below taken from Google Trends. As you can see the interest over time for “infographics” and “infographic” has increased quite dramatically over the past 2,5 years. In fact, see at the end, the interest is still rising even today.

Third. Infographics are very sharable. Infographics are one of the most effective ways to share knowledge on a subject. What’s more people who love the subject (or like it) will usually re-share the infographic if they find it interesting. Part of the reason is that people on Twitter are always looking to re-share information (you know a lot of people gain authority and show they are interested in a niche by constantly reminding people that you are always reading and sharing relevant content – however, you should be sure to read and understand what you share). Finally and mostly importantly infographics are easy to share and then get re-shared.
Of course it’s not just that infographics are easy to share, they are also very quick to produce. If you find a really good topic you can whip up an infographic about it within an hour or less. A great article, like this one, will take you at least a day to write and if your article needs to be researched it could be closer to a week.
Ok. That covers some of the basic reasons why I really love using infographics. Let me continue this piece with three major points that you should consider if you want to generate real traffic to your blog using infographics.
1. Find your infographics content
Great content doesn’t come from nowhere. You need some inspiration and that means doing some research to find it. For infographics especially if you want to create killer content you need to do a lot of research and double check all of the facts. Here are four hard and fast rules you need to know about creating a great infographic.
– Relevancy
Though making an infographic about certain controversial topics seems like an easy way to go viral make sure you stay relevant to your niche.
– Useful and interesting content
You need to find useful content and interesting content . Yes, no one wants to read crap info (and they won’t share it too if they don’t like it).
– Up to date
Everyone loves to be the first to know about stuff. So mixing the useful and interesting content with the up to date trends about the content is a good base for getting people to share your infographics.
– Use Other Peoples Ideas
You don’t need to be original all of the time. In fact, the best way to get great ideas for viral infographics is usually by identifying content that you know will be popular.
Do Your Research:
Besides using a search engine there are a lot of different tools that you can use to find popular content to use for your infographics. Here are two free research tools you can use to find popular (the most influential sites) created in your niche:
- Alltop: This site was created to answer that tough question; “What’s happening online?” The site lets you browse by category the most popular sites in any niche and then they also list the most popular articles from those sites (they give the 5 top articles for each site on the list). It’s a great go to research tool purpose built for sneaky researchers.
- BuzzSumo: Find the most shared articles in any niche. Just enter your topic and the site will rank relevant articles by how many social shares they got. Though the free user account only offers limited insights, it is still a great tool to see what works and what doesn’t work in your niche. Of course it also shows you what’s working now in your niche, which is kind of cool when you want to discover what’s hot and the moment and then turn it into something truly viral.
A nice thing about Buzzsumo is that you can also adjust the filter for your search result. For example, you can tick the only infographic option if you want to limit the results to just infographic (personally I wouldn’t recommend copying other people’s popular infographics and instead try and convert the most popular articles into a really great infographic).
The final thing that you’ll need to do once you’ve found your content idea is back up your infographic with some great data. Now there are a lot of organizations that have published large data sets online that you can access. This useful article by Flowing Data gives 30 different places that you can get data to back up your infographic.
2. Create interesting infographic
After you have found some awesome content, the next thing that you should is create an interesting (and easy to digest) infographic.
You can use Youzign to create your own infographics, to find out more watch this video. Don’t worry if you are not born with the skills of a graphic designer, the ready made templates make it really easy to use.
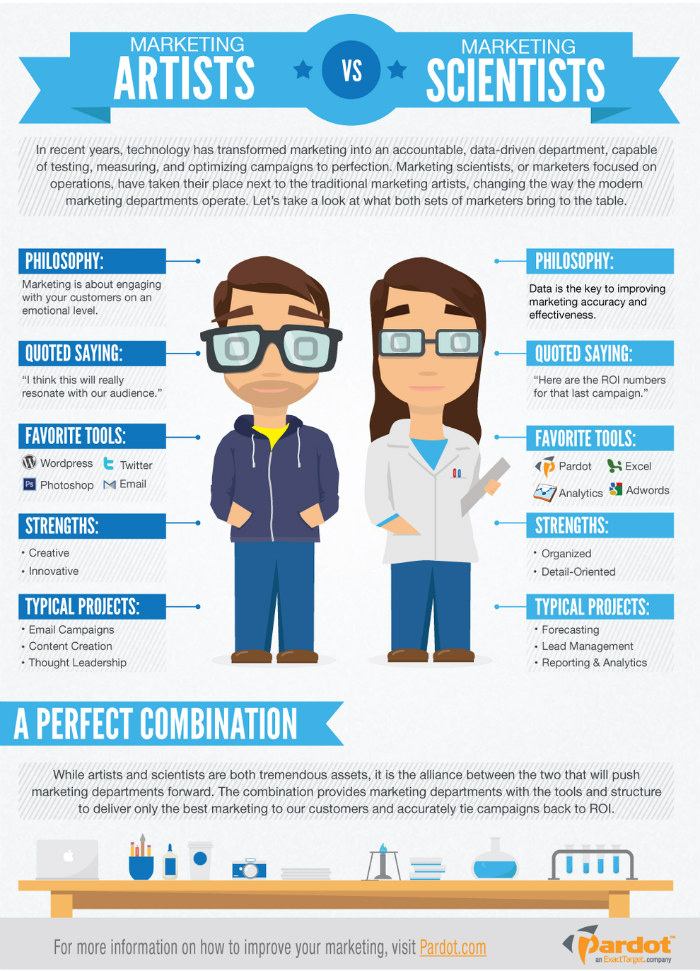
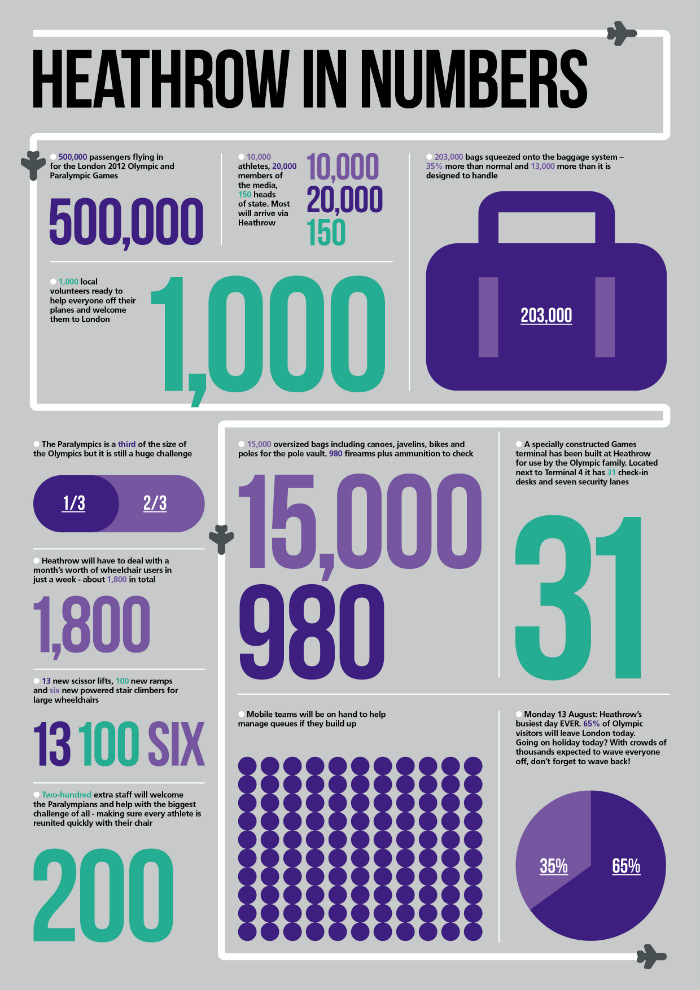
If you love infographics, you will realize that there are actually eight different types of infographics; Visualised Article, Flowchart, the Timeline, Useful Bait, Versus Infographic, Number Porn, Photo Infographic and Data Vis.
Two types of infographics that are quite popular include the “Versus Infographic” and “Number Porn”. Check out the examples below.
Take time analyzing the types of infographics and it will give you an idea of the types of infographics that works well. Besides this, here are several things that need your attention when you are creating your infographics:
– Great headline
Great headlines certainly help to convey the content. A perfect headline for an infographic should be short, clear and inviting. You want people to read more about it. Check this infographic to learn more about what makes a good headline and how to write it.
– Keep it simple
Clear design with you content divided into several sections. Don’t forget to include a call to action at the end.
People naturally loves clear, sleek design, but this is also something that you can connected to your niche. For example if your blog niche is business then people need to have a “reliable” source. Divide your points into sections to make it easier to digest this way people can get the main points immediately.
– Looks attractive
Yes I did say keep it simple before this point, but an infographic that is visually appealing will share well so make sure your infographic looks attractive, but still has consistent styling and colours.
Simple or complex? Which one works?
In my personal opinion I would keep your infographic simple! You want people to be able to get the main points quickly. They don’t want to be scratching their head as they look at the infographic.
3. Publicize it
You must promote your infographic or it won’t get any kind of restul! Yes, exactly.
You can’t just find great content, create an amazing yet simple infographic and hope for a miracle. You won’t wake up one morning to discover your infographic is bringing you thousands of visitors. That is not going to happen! You have to make it happen!
I tell you what. With so many interesting things on the Internet, you really need to amplify the message!
There are several ways to promote your infographic:
– Database
Mailing your email list or database is a good starting point if you want to promote anything related to your blog. Your subscribers are usually very keen to know the latest thing that happens on your blog. So they would be really happy to get your infographic too.
Make sure that it is easy to share your infographic give a clear call to action to help them share it. For example you could use something like this: “If you think that this infographic is useful, why not share this with your friends” or “If you find this infographic interesting and want to let other people know, share or embed this great infographic on your blog!”.
– Social Media
You can plan your own social media plan for promoting your infographic. Some of the obvious platforms that you can use include Twitter, Facebook, Google+, Stumbleupon and Pinterest.
Make sure that the image that you create fits for each platform when you are promoting your infographic. Remember you don’t have to include the full infographic, but only a small part of it with link to the full infographic will work.
A tip for Twitter, make sure to repeatedly re-share the same infographic at different times over the course of a week. Promoting your stuff in a natural and conversational way works best rather than tweeting it and asking for a RT.
You can use this tool and find out on Twitter the people who are interested in the same topic that you just created an infographic about. You can tell them about your infographic by sending them a direct message and don’t forget to personalize your message. People do appreciate a personalized messages. The least you should do is state their name.
You also need to remember to put various social media sharing button at the end of your article. Make it as easy as you can to share your infographic.
– Directories
You must know about some of these infographics directories. visual.ly, coolinfographics.com, infographicjournal.com and many more. Submitting your infographic to directories can leverage the message too.
– Traditional way
Through Google search, you can find people who are interested in the same subject as you. Reach out to them and spread the word. Set time aside to read about the article that they have written regarding the subject that relates to your infographic. Give genuine response and tell them about your infographic, and you can also ask them to embed the infographic on their blog.
You can also send an email to them. A short and personalized email usually works. Don’t forget that you should give a clear indication of the subject. Keep your email subject line short.
***
So that is all from me. I hope you find this article useful and let me know how much traffic you get from your infographic by implementing this guide.
Your go. How do you think? Have you ever tried to get more traffic by creating an infographic? How was it? Share your thoughts/experiences in the comments below!
Leave a Reply